Asking & Answers
Dashboard
Pin generated charts to dashboards for quick access, and organize or share them.
The Dashboard lets you pin charts you have generated so the visual insights that matter most remain readily accessible.
Multiple dashboards
NQRust Analytics supports more than one dashboard per user, so you can organize different sets of charts into separate dashboards and switch between them as required.
How to use the dashboard
Generate a chart in one of your threads.
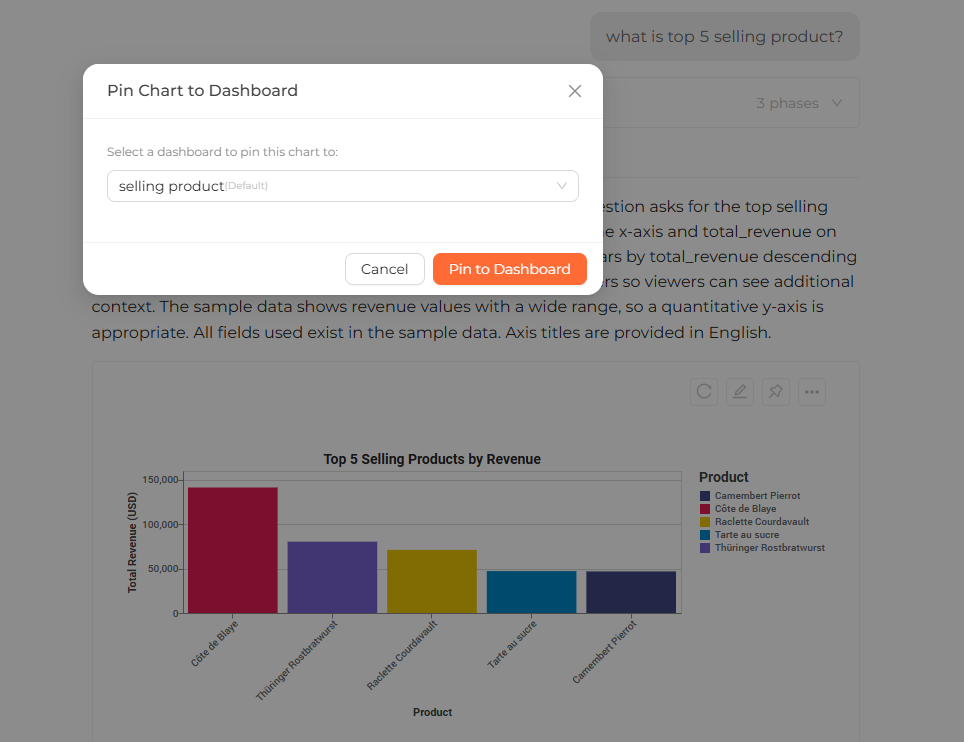
Pin the chart. A pin icon appears at the top of the generated chart — click it to add the chart to a dashboard.
Access pinned charts. Open the dashboard to view every chart you have pinned.
 A dashboard displaying several pinned charts arranged in a grid
Managing your dashboard
- Unpin a chart — open the pinned chart and choose Delete to remove it from the dashboard.
- Resize a chart — click and drag the bottom-right corner of the chart.
- Reorder pinned charts — drag and drop charts within the pinned charts area to rearrange them.
Sharing a dashboard
NQRust Analytics lets you share dashboards and threads with others, so colleagues can view the insights you have assembled without rebuilding them.